Back to Projects
September 2026| Web Development

Purrpose: Finding Balance Between Hustle and Recovery
Purrpose: Finding Balance Between Hustle and Recovery screenshot 1

Overview

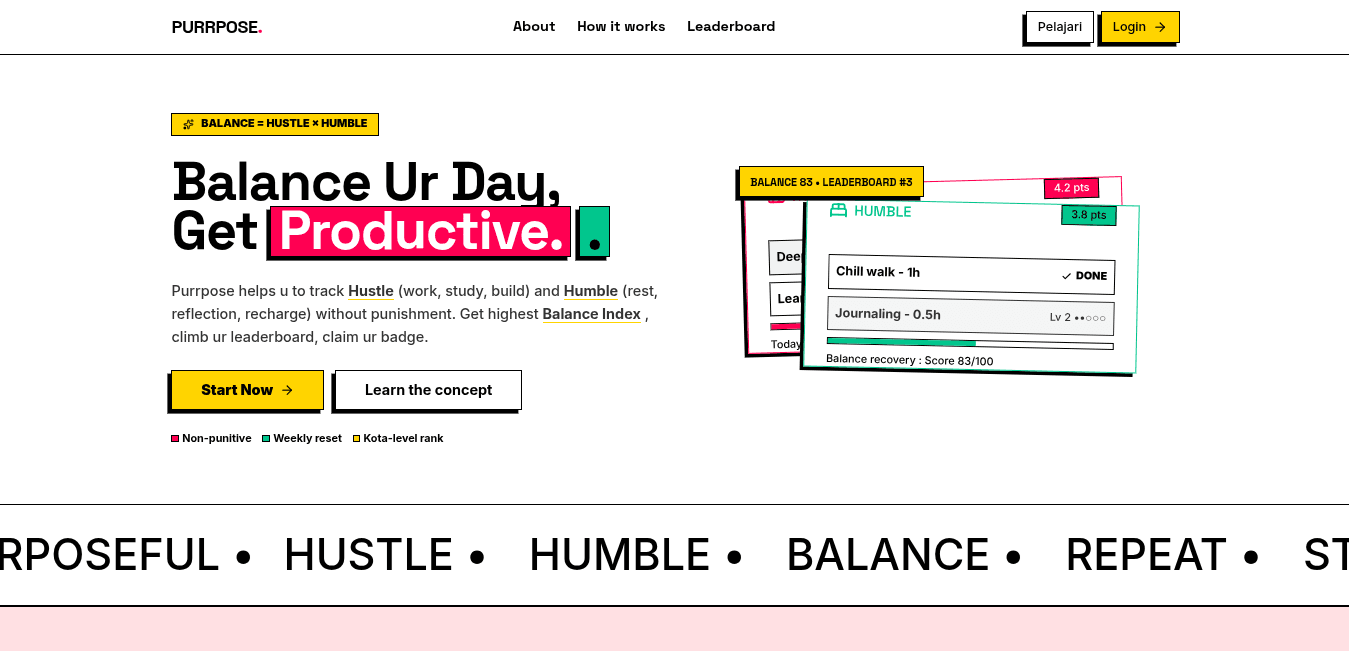
Most productivity apps only measure how much you get done. They push you to check more tasks but rarely ask if you have rested enough to keep going. Purrpose was built from that gap. It is a gamified web app that helps you track both productivity and recovery, so you can stay ambitious without burning out. The idea is simple. Every daily task is split into two categories. Hustle covers demanding work like jobs, studies and meetings. Humble covers recovery like sleep, meals, exercise and time to relax. You add tasks manually each day, set a level from one to five for how intense or restoring it feels, and add a duration in hours. The score is level multiplied by duration, which keeps the system transparent and easy to understand. The purpose is to reward balance over raw output. Each week the app shows a balance index from zero to one hundred, where fifty means an even split between hustle and humble. Lean too far to one side and the index drops with a gentle nudge to adjust. Unfinished tasks do not subtract points, but they lower your completion rate and affect your leaderboard standing, so consistency still matters. The goal is to help you see your patterns and build a rhythm you can sustain. The tech stack is modern and lean. The frontend uses Next.js 16, React 19 and TypeScript, styled with Tailwind CSS v4 and a Neo Brutalism system that gives the app its bold colors and playful look. Components come from shadcn/ui and Radix UI, charts use Recharts, and forms use React Hook Form with Zod. The backend runs on Firebase with Firestore, Auth for email and Google login, and Cloud Functions for scoring and scheduled jobs. It is hosted on Vercel for the frontend and Firebase for the backend. Gemini 1.5 Flash powers AI suggestions and ip2location.io handles city detection. Features bring the idea to life. You can create, edit and complete tasks with real time updates, see a live score preview and get a warning when you approach the daily limit. Scoring is server side with a sixteen hour cap per task and a twenty four hour cap per day enforced through transactions. Daily reports summarize what you finished, while weekly reports show balance, score distribution and a four week trend with suggestions that fall back to rule based advice if AI is unavailable. The weekly leaderboard groups about fourteen users by city with a province fallback and weighs scores by balance and completion rate, with demo PurrBots for new users so the board never feels empty. The top three each week earn gold, silver and bronze badges. Other details include timezone detection, secure sessions and strict Firestore rules that block direct score writes. Purrpose started as a task tracker but became something more. It shows that real productivity is not about doing more every day, but about finding a rhythm where hustle and recovery support each other.

Technologies

#Next JS#Tailwind CSS#Firebase

Share

LinkedInTwitterCopy Link
Decorative Sun

Next Projects

sun
Kelolain : ERP IT Consulting

Kelolain : ERP IT Consulting

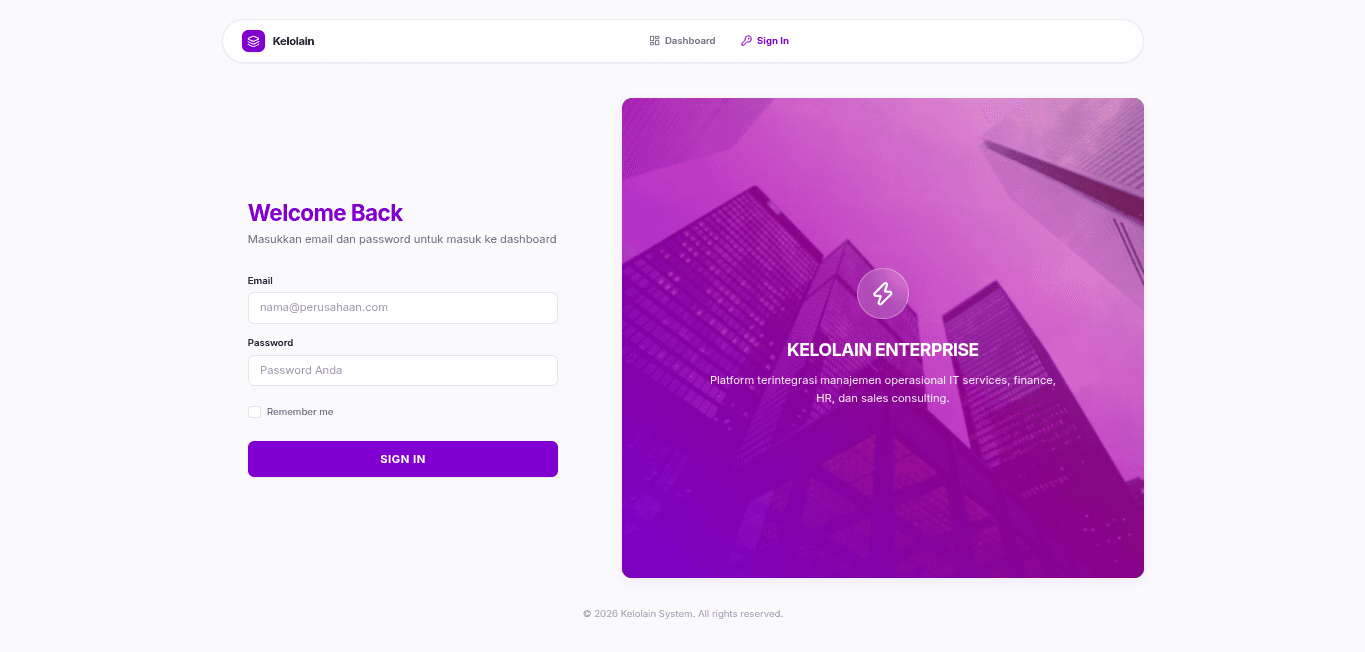
It started with the premise: a company sells a combination of products and services. It needed to manage human resources, finance, inventory, and sales in one centralized platform, rather than using various separate spreadsheets. However, behind that premise lay complex issues: a balanced accounting system, a payroll system that must comply with government regulations, consistent stock levels, and seamless integration of business processes. I designed this application to be entirely server-side rendered using Laravel Blade and Livewire, with no Single Page Applications, no mobile apps, and no third-party integrations consuming JSON APIs in the initial stages. It was a simple software design. However, the internal ERP tool used by some staff didn't require the operational burden of a separate frontend or the discipline of API version management. What was needed was rapid iteration and an intuitive, uncomplicated user interface. The combination of Blade and Livewire perfectly suited this. The system is structured into four business modules: Identity & Access Management, Finance & Accounting, Sales & Inventory, and HR & Payroll. Everything runs within a single Laravel application. Each module has its own migrations, routes, and service classes. These modules do not directly access each other's internal components. I made this decision solely because of the disciplines enforced by a microservices architecture: clear boundaries, prohibition on directly accessing tables belonging to other domains, and communication through explicit contracts. That's the approach offered by a modular monolith. The modules communicate with each other through Laravel events, rather than direct method calls. When a Sales Order is marked complete, the system doesn't immediately access the Finance module to create a journal entry. Instead, the system triggers the SalesOrderCompleted event. A listener within the Finance module then responds to the event through a queue, so slow or failed accounting operations don't hinder users from processing new Complete Orders. Because the boundaries between modules are event-based, adding another business module connected to the same accounting engine requires much less effort than if the Sales and Finance modules were tightly coupled from the start. Journal entry engine: Every financial transaction in the system—such as a completed sale, payroll processing, vendor invoice, or payment receipt—ultimately generates a journal entry with debit and credit lines that must balance precisely. The engine creating these entries rejects anything that is unbalanced, even down to the smallest cent. Once posted, the data becomes immutable. Errors are corrected through an explicit void action accompanied by a mandatory reason; the audit trail must withstand rigorous scrutiny. Indonesian employee income tax (PPh21): This is the part of the system I oversee most strictly. As of 2024, Indonesia calculates monthly income tax withholding using a scheme called TER (*Tarif Efektif Rata-rata* or Average Effective Rate)—a rate determined by a table of brackets based on the employee's marital status and number of dependents. I input the official rate table data directly from the relevant regulation (PMK 168/2023) and validate the calculation logic against the Indonesian tax authority's official calculator. The payroll module also handles prorated calculations based on attendance: if an employee is absent without authorization during a pay period, their base salary is reduced proportionally, whereas paid leave and sick days are not subject to deductions. Identity & Access Management: Role-based access control built upon granular permissions. Consequently, "Sales Staff" and "Finance Managers" possess genuinely distinct capabilities enforced at the policy layer, rather than merely having certain menu items hidden from view. Finance & Accounting: A hierarchical chart of accounts and the previously described journal entry engine with balance guarantees. Profit and loss statements and balance sheets are available; the balance sheet calculates retained earnings in real-time, as the system does not yet feature a year-end closing process. Sales & Inventory: A product catalog that distinguishes between physical goods and services; sales orders that can combine both within a single contract; and stock that is reserved when an order is created and subsequently released or fulfilled based on the order's completion status. Order completion triggers synchronous invoice generation and initiates an event that creates accounting entries. HR & Payroll: Management of employees, departments, and attendance, along with the previously described payroll system—complete with calculations for BPJS contributions (Indonesia's social security and health insurance scheme) that split the cost between the employee and the employer. User-customized dashboards: The displayed charts are determined by access rights and tailored to information relevant to the user's specific role. Sales staff view revenue trends and top-selling products; finance staff view cash flow and accounts receivable aging details; and HR staff view headcount and payroll cost breakdowns.

Retinal Diseases Diagnosis

Retinal Diseases Diagnosis

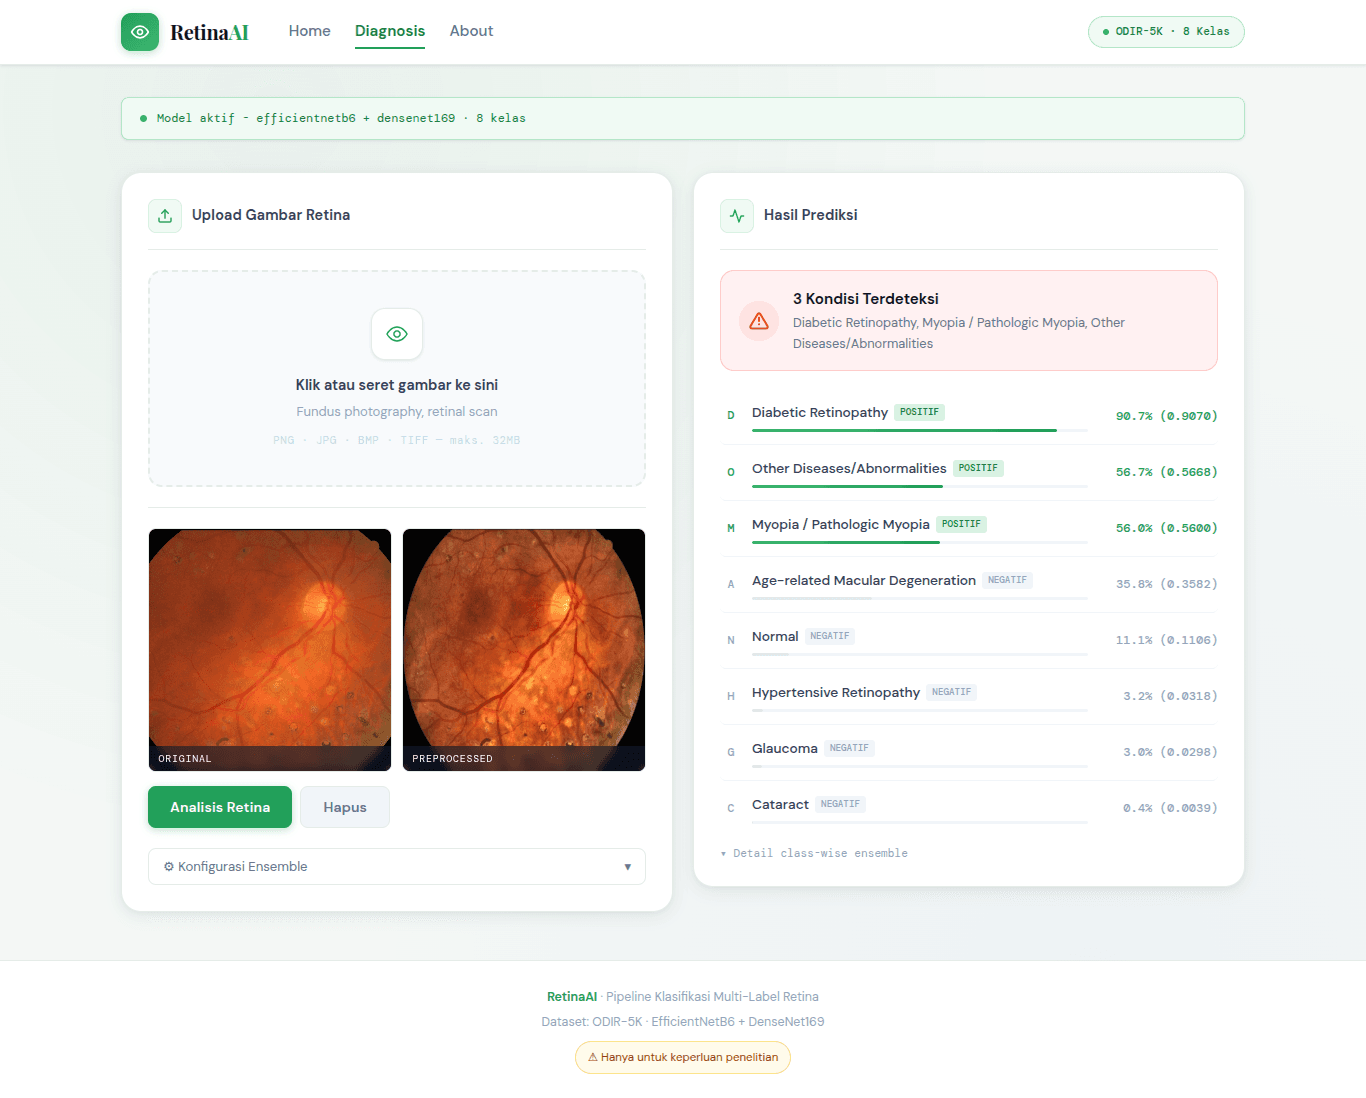
Retinal diseases are among the leading causes of visual impairment worldwide, and their diagnosis becomes increasingly challenging because patients often present with multiple pathological conditions simultaneously. This study addresses the problem of multi-label retinal disease classification by proposing a class-wise ensemble learning method based on a weighted averaging algorithm. The proposed approach was evaluated using the ODIR dataset, which contains retinal fundus images from 3,500 patients categorized into eight disease labels with a highly imbalanced class distribution. The research workflow consisted of data preprocessing, including oversampling, image enhancement, and data augmentation, followed by fine-tuning two baseline deep learning models, EfficientNetB6 and DenseNet169. The core contribution of this study lies in assigning independent contribution weights to each model for every disease label according to its validation performance, and integrating these weights through a weighted averaging scheme during prediction. Model performance was evaluated using AUC, precision, recall, and F1-score at both the per-label and global levels. Experimental results demonstrate that the proposed class-wise ensemble achieved the best overall performance, with a micro-AUC of 0.89 and a macro-AUC of 0.85, outperforming both individual models and conventional ensemble methods without class-specific weighting. These findings indicate that the proposed method effectively improves multi-label retinal disease classification, particularly for minority disease labels with highly imbalanced distributions. To facilitate the development and evaluation of the proposed method, a prototype web-based application was developed using the Flask framework. The system enables users to upload retinal fundus images through a file uploader on the main interface, where a preview of the selected image is displayed automatically. Users can further configure prediction parameters, including the classification threshold and the model to be used, through dropdown menus. Once the image and model configuration have been selected, the prediction process is initiated by pressing the prediction button. Before inference, each uploaded fundus image undergoes an image enhancement preprocessing pipeline consisting of auto-cropping, Contrast Limited Adaptive Histogram Equalization (CLAHE), and resizing. The preprocessed image is then fed into the best-performing classification model to extract visual features and predict the presence of retinal disease labels. After the prediction process is completed, the web application presents the preprocessed image alongside the classification results, including the predicted probability for each disease label and the final positive labels detected in the retinal image.